Abnormal Data Patterns on 10.16098/j.issn.0529-1356.2025.02.014
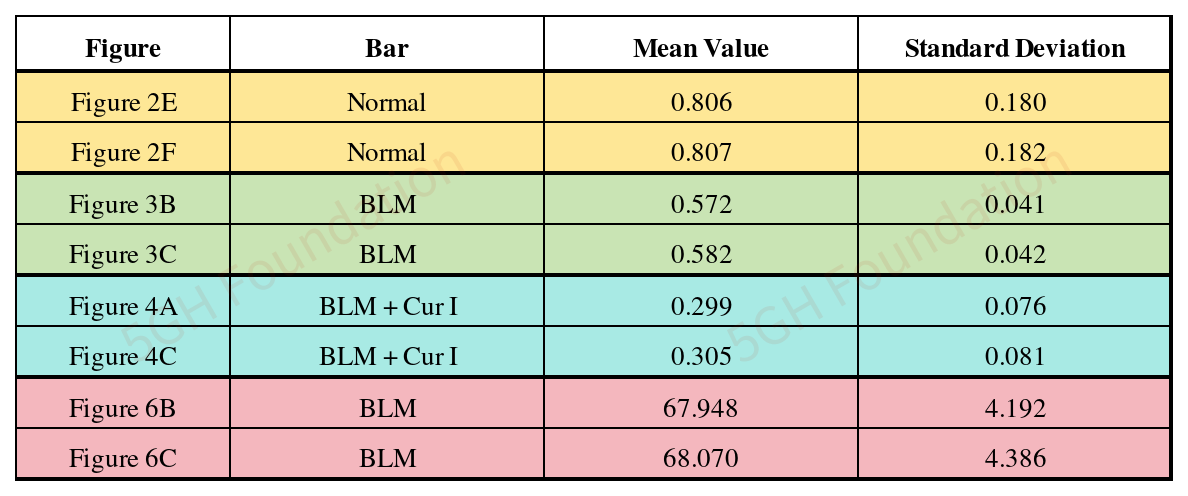
Recently, the 5GH Team obtained a document suggesting abnormal data patterns in the article [1]: (1) the “Normal” bar in the Figure 2E has same mean value and standard deviation as the “Normal” bar in Figure 2F, (2) the “BLM” bar in Figure 3B has same mean value and standard deviation as the “BLM” bar in Figure 3C, (3) the “BLM + Cur I” bar in Figure 4A has same mean value and standard deviation as the “BLM + Cur I” bar in Figure 4C, and (4) the “BLM” bar in Figure 6B has same mean value and standard deviation as the “BLM” bar in Figure 6C. Meanwhile, the document also suggests overlap between some western blots in Figure 4C and 4D.
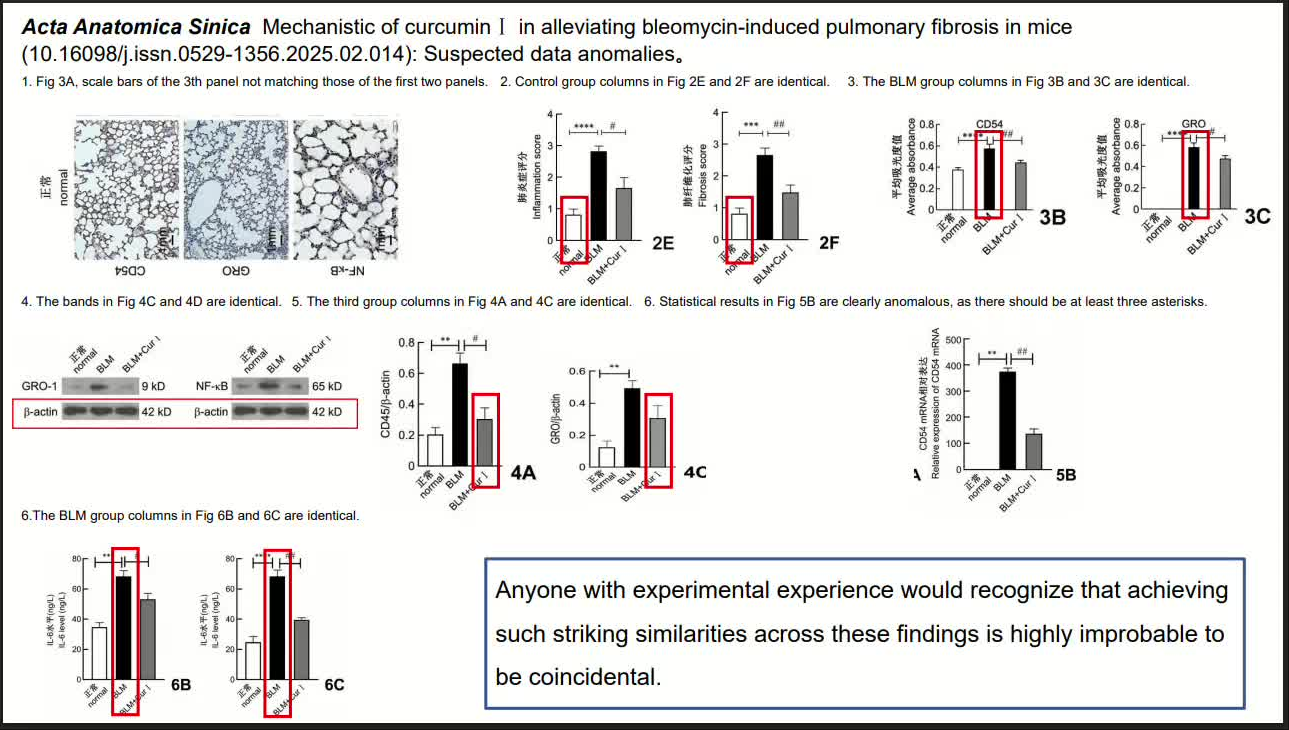
Following these cues, the 5GH Team extracted the mean values and standard deviations of the above-mentioned bars using the Automeris APP, thereby corroborating the abnormal data patterns suggested by the document. However, the origin of these anomalies remains uncertain: they may stem from coincidental fluctuations, inadvertent data misapplication by the authors of article [1], or other unaccounted factors. While such irregularities do not inherently imply misconduct, the reliability of the conclusions drawn in article [1] warrants further scrutiny.
Reference